
I am fascinated by navigation and maps. When I visit a new location one of the first things I do is getting a topographical map of the region. Sometimes I use historical maps, like the Werbata map (dating from 1911, see also Wikipedia) for my trips to Curacao. Since 2007 I log my activities (like running, hiking, cycling, swimming, surveying) using GPS (TomTom watch) and I like to plot these on a map online. Since surroundings change, I like not only to have the most current maps, but also historical maps. As a Dutchy a found the Kabouterbond maps worthwhile. Since 2012 the PDOK Basisregistratie Topografie (BRT) maps which can be downloaded for free in raster or vector format. PDOK is a cooperation between het Kadaster and the Dutch government.
So I end up with a collection of digital maps which I like to use with OziExplorer (for route planning e.g.) and online on my own websites. This post describes the way I proceeded to serve my maps for online usage.
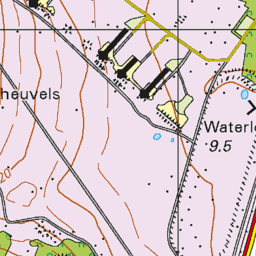
PDOK based vector map from my server, described in this post
Introduction
Tiles
To use maps online, you like to be able to pan and scroll through the maps and you like zoom out to overview and zoom in to detail. To serve maps online for usage on websites it is not handy to serve the map as one huge file since it would take ages to download. It is common to serve a map as tiles. Think of cutting the map up front into pieces, the tiles, of, for example, 256×256 pixels. If you display a part of the map, say 2048×1024 pixels, it means you have to provide 8×4=32 tiles. Since the tiles are generated up-front and browsers can request multiple tiles at once in parallel, serving can be blazing fast. Being able to zoom requires to have tiles prepared at various zoomlevels, usually around 15 levels. A next higher zoom level is a factor 2 in length scaling, so the same tile is covered with 4 tiles in this next zoom level.

This implicates scaling from level 1 to 16 means a scale factor of 215 = 32.768 times. It means that 1 tile at level 1 is covered by 4×32.768=131.072 tiles at level 16, which is a whole bunch of tiles. If a tile covers 370 m on most detailed level 16, a tile on least detailed level 1 covers 12000 km, which is roughly one third of the earth circumference.

Popular viewers like Leaflet or MapBox GL are tile based. Even the off-line OziExporer program uses a proprietary tile based format (.ozf3, .ozf4)
For storing map tiles the MapBox .mbtiles format is elegant and well supported: all tiles are stored in one database file, based on sqlite. Since tiles have to be prepared up-front at various zoom levels .mbtiles file can be huge. 10 GByte is quite common for raster based maps of the Netherlands.
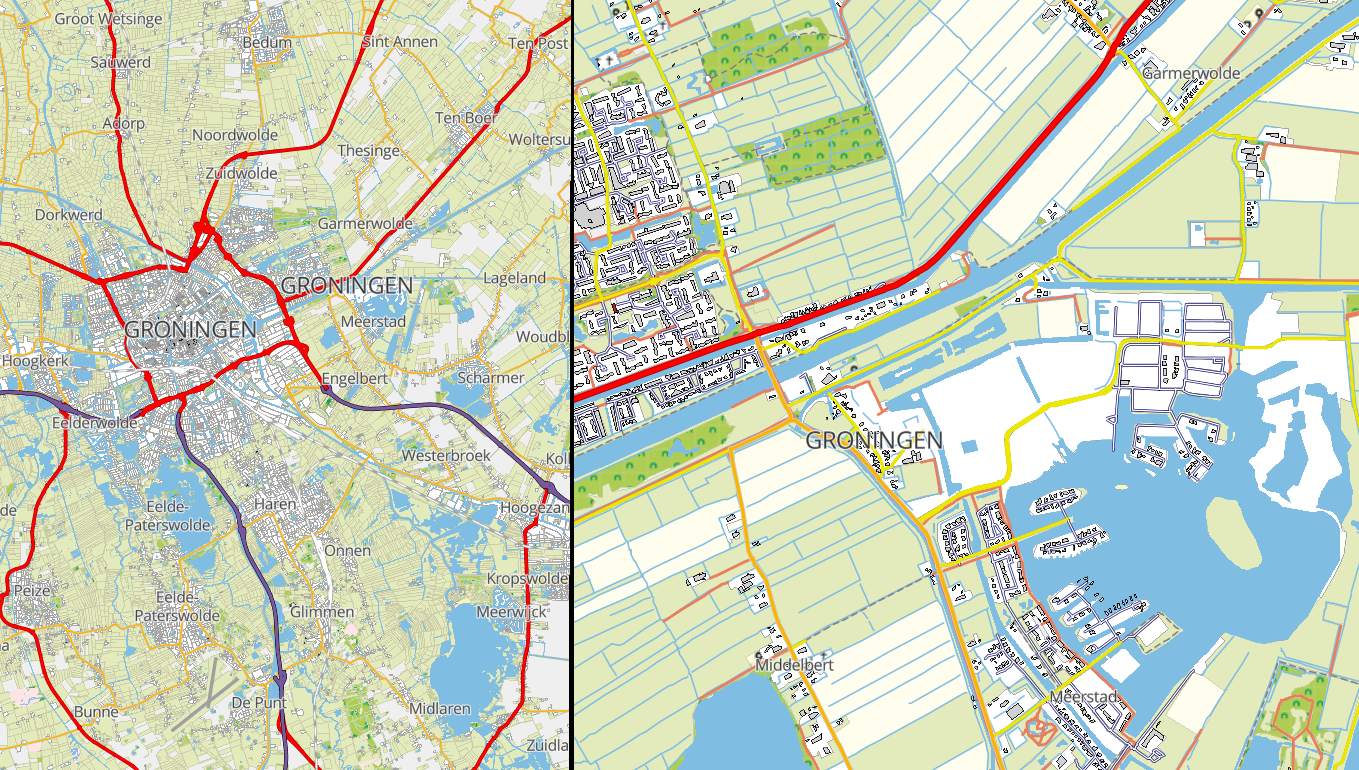
Vector vs raster
Two ways exist to serve tiles: raster based or vector based.
Raster tiles are basically images like png or jpg format. They are generated in advance, usually starting with the most detailed level and then scaling them to less detailed levels. What you generate is what you get. Advantages of raster tiles are:
- Fast: no need to render, just display an image
- Predefined optimized layout, in which map items are placed e.g. without overlap
Vector tiles contain the ‘raw’ geographic data of objects (features) making up the map, like locations (as points) roads (as lines), meadows (as polygon), etc. together with information (fields). Vector tiles usually are smaller, but require rendering and styling to visualize them as map. This usually requires more performance since maps have to be rendered real-time (server side or client side). Advantages of vector tiles:
- Smaller tiles. My PDOK vector mbtiles file is about a tenth of the size of the the raster mbtiles file.
- Stageless zooming, whereas raster tiles usually are generated at discrete zoom levels.
- No pixelation when zooming in. Rounding off errors though. I generated up to zoom level 15 tiles. Up to level 20 no rounding off effects. Displaying zoom level 10 tiles at zoom level 20 (factor 1024!!) shows jagged edges.
- Dynamic styling is possible, for example letting the detail level increase with zoom level, resulting in overview-style when zooming out and detail-style when zooming in
I did not find any styling definition for PDOK vector maps. So as part of this project I created a style for PDOK top10nl maps.
PDOK offers both types of map data for the Netherlands.
Terminology
Layer: collection of features
Feature: a single map object like a building, height line, terrain. A feature has a geometry like Point or Polygon
Field: an attribute of a feature, like building type, name, height
The tile server
For making tiles available for on-line usage you need a tile server. A tile can be requested with a URL like https://tiles.studioblueplanet.net/data/werbata/17/40393/61054.png. The zoomlevel is 17, 40393 and 61054 are x and y locations.
TileServer PHP
An elegant open-source program is TileServer PHP. It is a github project basically consisting of one php file tileserver.php. You make it available on your webserver (Apache, NGiNX, …), place .mbtiles in the same directory and it works right out of the box. It shows each MBTiles file and it contains various viewers for raster and vector tiles (Leaflet, Openlayers 2 and 3, Mapbox JS, etc). On my low-power Pentium based server (Centos8, NGiNX) it is fast enough for me.
I used it for a couple of years. I found a drawback that it has dependencies to online files, for example the index file is retrieved from the Klokantech site. And it appears to collect Google analytics information without me knowing, as can be seen below…

TileServer GL
The server
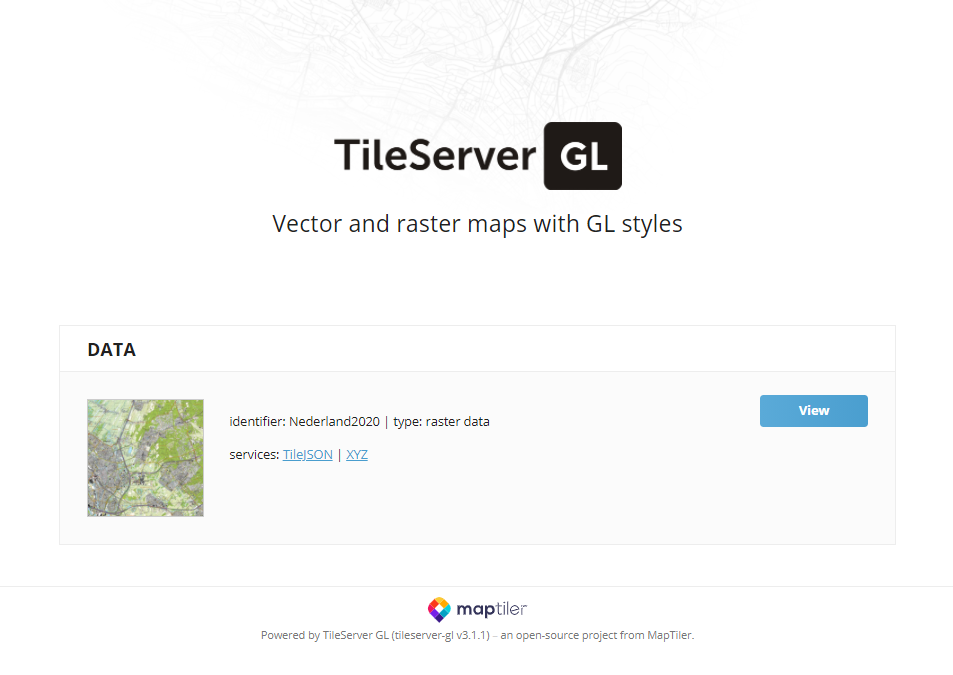
TileServer GL is also an open-source project to promote MapTiler. It contains the http server serving tiles. It contains the feature to convert vector tiles to raster tiles on the fly.
The easiest way is to kick-start the application from a Docker image (it is possible to build it yourself as a NodeJS project, I did not succeed).
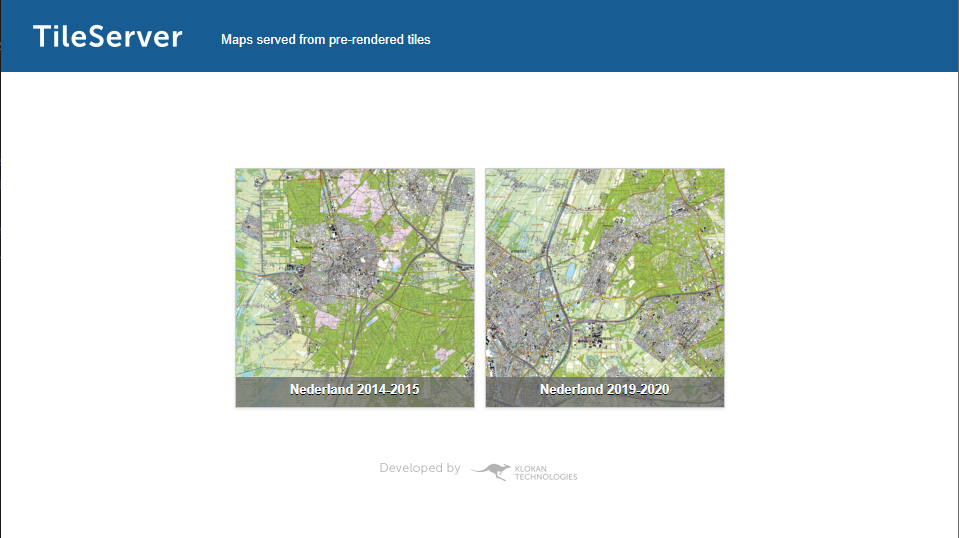
docker run --rm -it -v [mapdir]:/data -p 8080:80 maptiler/tileserver-glIn this [mapdir] is the volume directory that contains configuration and map files. By default and without further configuration it servers the first MBTiles file it encounters. http://localhost:8080 shows the result:
It can be started serving a particular map, if more than one MBTiles file exists:
docker run --rm -it -v [mapdir]:/data -p 8080:8080 maptiler/tileserver-gl --mbtiles Nederland2020.mbtilesNote that -p 8080:8080 is in this case required since for some reason if it is omitted the server inside the container starts listening on port 8080 (the server displays the port it is listening on: ‘Listening at http://[::]:8080/‘).
In order to start the server in the background (detached), start it using:
docker run --rm -d -v [mapdir]:/data -p 8080:80 maptiler/tileserver-glRefer to the docker documentation on how to stop a container.
The config file
When you want to serve multiple maps (and styles), the config file is the most easy to use. Start the TileServer GL in the following way to generate a config file config.json:
docker run --rm -it -v [mapdir]:/data -p 8080:8080 maptiler/tileserver-gl --mbtiles Nederland2020.mbtiles --verboseThis results in, for example, displaying the following JSON which can be saved to config.json:
{
  "options": {
    "paths": {
      "root": "/app/node_modules/tileserver-gl-styles",
      "fonts": "fonts",
      "styles": "styles",
      "mbtiles": "/data/maps"
    }
  },
  "styles": {},
  "data": {
    "Nederland2020": {
      "mbtiles": "Nederland2020.mbtiles"
    }
  }
}
Refer to the manual for the exact syntax of the config.json file. The next time you start TileServer GL it automatically reads the config from config.json. When you want to add more maps, simply extend the data section
  "data": {
    "Nederland2015":
    {
      "mbtiles": "Nederland2015.mbtiles"
    },
    "Nederland2020":
    {
      "mbtiles": "Nederland2020.mbtiles"
    }
  }
Creating the MBTiles files
MBTiles from PDOK BRT maps
We can download map files from the PDOK site. Files are available as
- Raster files
Files are downloaded as GeoTIFF files. These are .tiff files with geographic information added. - Vector files
Files can be downloaded as GML files or as GeoPackage (GPKG) files. We use the GPKG files. Files can be downloaded in various detail levels. We use the Top10NL files.
We use GDAL tools to convert the map files from PDOK to MBTiles format. The easiest way to use the tools is using the docker image. Next command executes the gdalinfo tool to show information about a map file.
docker run --rm -it -v [mapdir]:/home osgeo/gdal:ubuntu-full-latest gdalinfo /home/kabouterbond2004.mapThe directory [mapdir] is the directory/volume containing map files. It is mapped internally to the /home directory in the docker container.
Under Windows 10 we can also use the binaries on GIS internals support site. In fact, the results on this page were mainly created using the 3.3.0dev core binaries (gdal-302-1911-x64-core.msi) from this site. Starting requires some additional shaping (e.g. in a .bat file; I mention it here since it took me some time to find out; see also here):
set GDAL_DATA=c:\program files\GDAL\gdal-data
set GDAL_DRIVER_PATH=C:\Program Files\GDAL\gdalplugins
set PROJ_LIB=C:\Program Files\GDAL\projlib
set PYTHONPATH=C:\Program Files\GDAL\


SET PATH=c:\program files\gdal\;%PATH%

ogr2ogr.exe --debug ON -fieldTypeToString Date -gt 65536 -f MVT  "nederland2020-10nl.mbtiles" -dsco FORMAT=MBTILES -dsco MAXZOOM=12 -dsco MINZOOM=0 -dsco MAX_SIZE=50000000 -dsco MAX_FEATURES=20000000 -dsco NAME=Nederland2020 "nederland2020-10nl.gpkg"
In the remainder of this post all the docker and windows start-up crap is ommited and we focus on he GDAL stuff.
Raster tiles
Raster based maps are the easiest to use from PDOK, since PDOK offers excellent topographic maps as 390 (!) GeoTIFF files covering the Netherlands at scale 1:25.000. together with information like a legend. They contain the usual details like landmarks, contour lines, occasional hill shading (recently), etc. I already encountered these topographic maps on paper (1:25.000) during fulfillment of my military service the at the early 90s of previous century.

We like to use the tool gdal_translate to convert the GeoTIFF files to .mbtiles format. Unfortunatelly, gdal does not allow for merging or appending multiple maps to the .mbtiles file. Therefore we need a merge to an intermediate format. The process flow will be:
- Merge GeoTIFF files in one single intermediate map
- Convert the intermediate format tot .mbtiles
For the merging we use OziExplorer MapMerge and the procedure is described in another post. However, we choose the map format to be PNG and not OZF4 (requiring the paid version of MapMerge). This results in a huge OziExplorer PNG based map (including the Oziexplorer .map file) containing the enitire map of the Netherlands.
We convert the map using
gdal_translate -of MBTiles -co NAME="Nederland" -co ZOOM_LEVEL_STRATEGY=UPPER Nederland2020_png.map Nederland2020.mbtilesAsuming 2.5 m per pixel scale, this results in tiles at zoom level 16. We now need to generate the less detailed zoom levels. This is done using gdaladdo:
gdaladdo.exe -r gauss Nederland2020.mbtiles 2 4 8 16 32 64This results in zoom levels 6-15.
Vector tiles
Merging
Vector based maps can also be downloaded from PDOK. They are available in GML format as well as Geopackage (.gpkg) format. We use the latter and we use the top10nl series (1:10.000).
Geopackage vs GML
The GML format is an XML format and has a number of drawbacks during the processing described here:
1. Some features contain multiple fields of the same type. For example typegebouw in the gebouw layer. This results in StringLists during conversion which are a bit tricky to handle during conversion. In the GPKG these field values have been concatenated using the (piping-symbol) into a neat String, e.g. ‘kerk|toren’.
2. The conversion (ogr2ogr) tries to deduce the field types from the source file. If in one file a particular field contain only single values it is regarded as a String whereas in another file the same field contains multiple values it is regarded in that file as a StringList. This results in inconsistent behavior when merging. We somehow have to provide a field definition during conversion.
3. Geometry types (Point, Line, Polygon, etc) are all mixed in each layer, whereas in the GPKG these geometry types have been neatly stored in separate layers (like top10nl_gebouw_punt, top10nl_gebouw_vlak, etc). When styling we need to filter on geometry type. Though this is possible, it cannot be combined with filtering on other fields due to shortcomings in MapBox.
4. The GPKG appear to contain more field types than the GML files.
5. GPKG files are packed per layer. GML files are packed per map (kaartblad). Each map contains a few mutual features, like the country or the province polygon. When merging, this results in multiple instances of the same feature. Some form of deduplication is required (ogr2ogr -preserve_fid option).
Therefore the geopackage GPKG maps make life a lot easier.
For generating vector tiles holds the same procedure: merge and convert. First step is merging. Unzipping the download results in 13 files, one file per layer. In order to convert with GDAL, we need to merge the layers. Remember, GDAL can only create a .mbtiles file, not append to it. The tool ogr2ogr from GDAL will do the job. We make a selection of 7 files and merge these in a file called nederland2020-10nl.gpkg. It will take a few minutes, no big deal.
ogr2ogr                 -f GPKG nederland2020-10nl.gpkg top10nl_Wegdeel.gpkg
ogr2ogr -append -update -f GPKG nederland2020-10nl.gpkg top10nl_Gebouw.gpkg
ogr2ogr -append -update -f GPKG nederland2020-10nl.gpkg top10nl_Plaats.gpkg
ogr2ogr -append -update -f GPKG nederland2020-10nl.gpkg top10nl_Spoorbaandeel.gpkg
ogr2ogr -append -update -f GPKG nederland2020-10nl.gpkg top10nl_Terrein.gpkg
ogr2ogr -append -update -f GPKG nederland2020-10nl.gpkg top10nl_RegistratiefGebied.gpkg
ogr2ogr -append -update -f GPKG nederland2020-10nl.gpkg top10nl_Waterdeel.gpkg
Converting
Now comes the fun: we need to convert the file to mbtiles. We again use ogr2ogr. However, this is going to take time. Much time.
ogr2ogr --debug ON -fieldTypeToString Date -gt 65536 -f MVT nederland2020-10nl.mbtiles -dsco FORMAT=MBTILES -dsco MAXZOOM=10 -dsco MINZOOM=0 -dsco MAX_SIZE=50000000 -dsco MAX_FEATURES=20000000 -dsco NAME=Nederland2020 nederland2020-10nl.gpkgThat much? Yes! Let’s analyse a bit. The option -f MVT indicates to use the mbtiles vector driver. --debug ON makes ogr2ogr produce some output. Otherwise it will be fully silent. The Date format is not supported by mbtiles, so -fieldTypeToString Date converts them to strings. nederland2020-10nl.gpkg is the input file, nederland2020-10nl.mbtiles is the output file. The -dsco options are for the mbtiles vector driver. -dsco MINZOOM=0 indicates the minimum zoom level to generate is 0, -dsco MAXZOOM=10 indicates the maximum zoom level tiles are generated for is 10. -dsco MAX_SIZE=50000000 is the maximum size of a tile. Wait! Wait! 50 MBytes? These are huge tiles!! Yes, indeed. however, setting this value smaller will make ogr2ogr try to fit the data in tiles by skipping features. A value of 5 MByte results in very bad tiles, with all kind of missing features. Same holds for the maximum number of features: -dsco MAX_FEATURES=20000000. Twenty million…
First ogr2ogr copies all the geopackage data to an intermediate database. Then it writes the data to MBTiles, and we end up with our beloved .mbtiles file of about 10 GByte. Now executing the file above took my PC (Core I7 processor, Windows 10) about 16 hours for zoomlevels 0-10 and 48 hours for zoomlevels 0-12. It consisted of continuously torturing of the harddisk (HDD). So I replaced the HDD by a 250 GByte SSD (50 euro at Mediamarkt). This reduced the processing time to about 18 hours for zoomlevels 0-15. (with all 13 source files merged)
Inspecting
Now add it to your TileServer GL and add in in the config.json to the data section:
"data":
{
....
"PDOK Top10nl":
{
"mbtiles": "nederland2020-10nl.mbtiles"
}
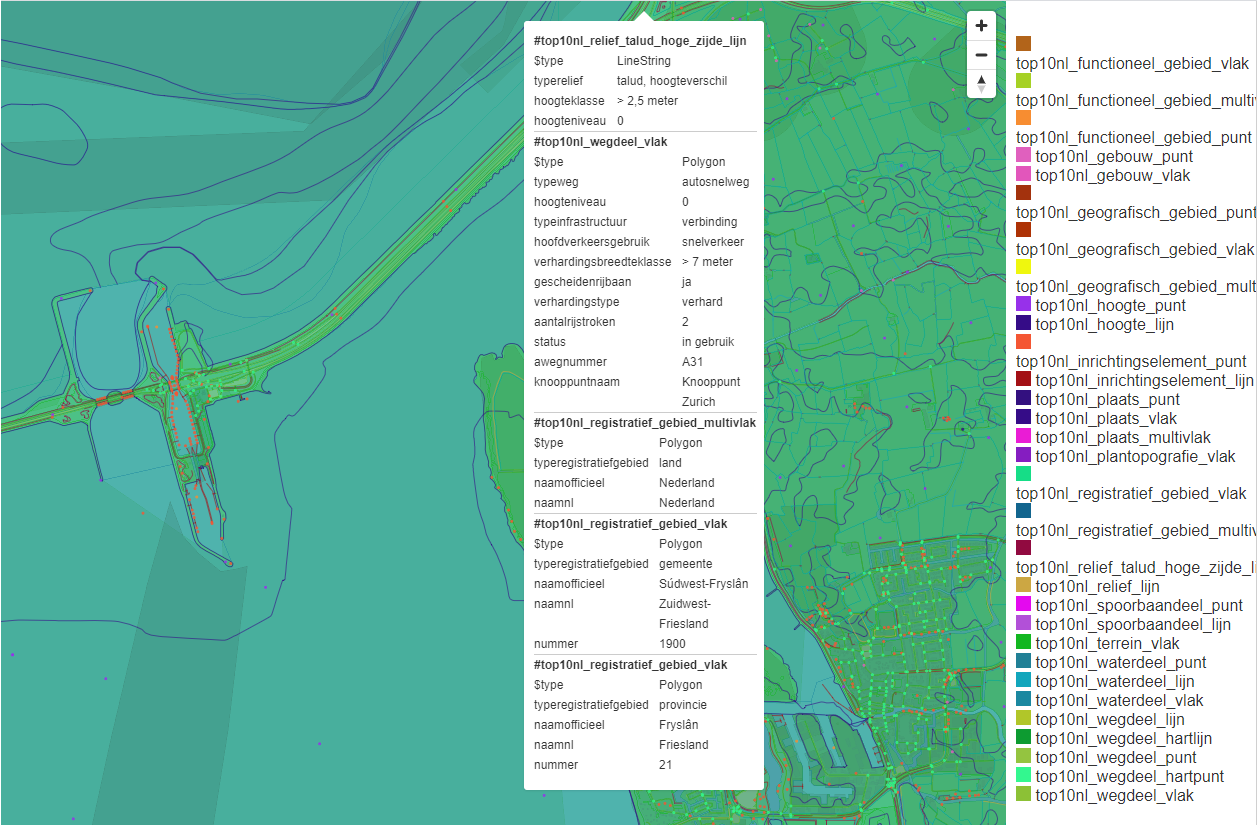
}Restart you TileServer GL and you will see the map appear in the data section of the web page. Clicking ‘INSPECT’ and zooming is going to download a couple of huge .pbf tiles, the fan in your laptop is going berzerk and you better get a cup of coffee when you start zooming in. Finally you end up with this:
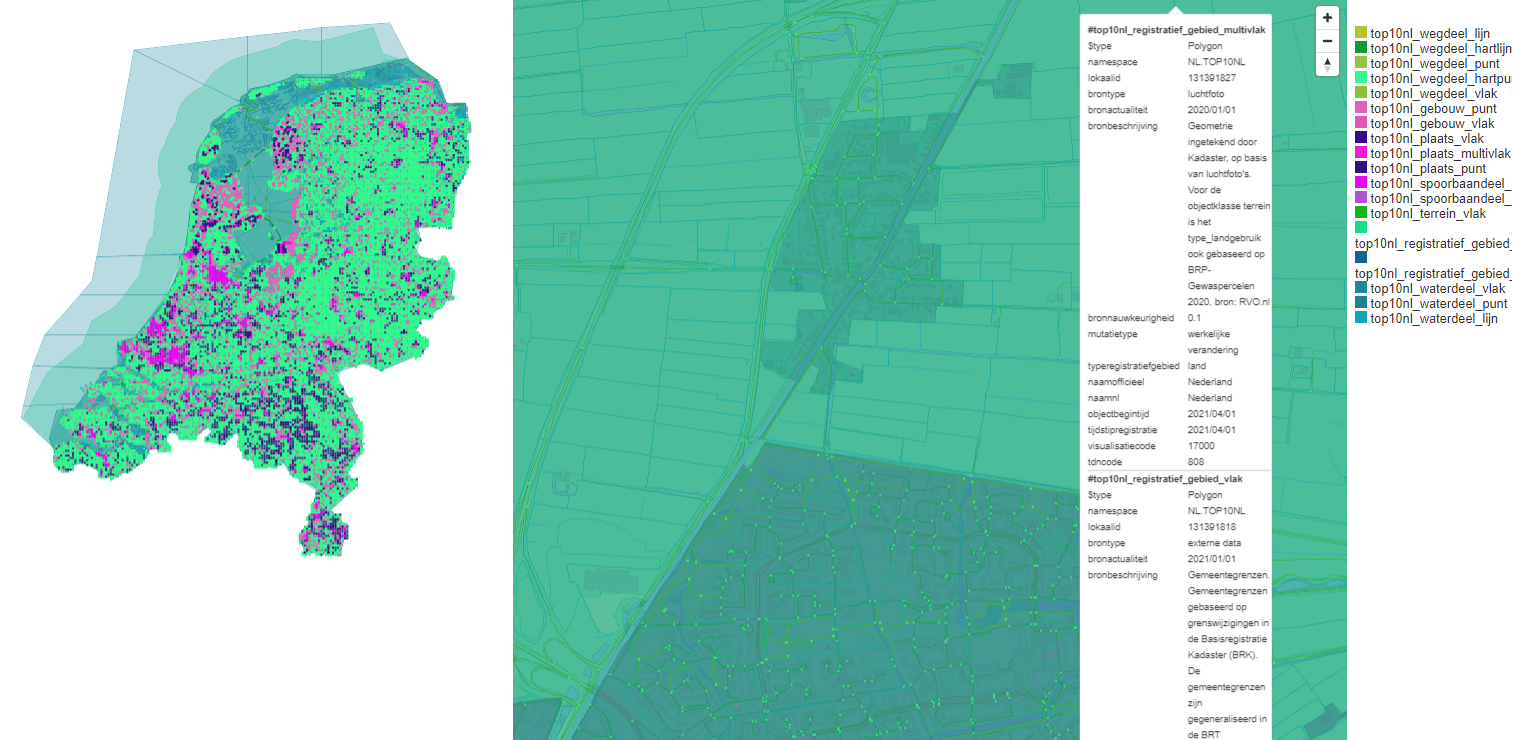
Basically, a vector map consists of layers with points, lines and polygons, each with a bunch of parameters. This is what is shown: each layer has its own color as shown in the legend. Roads are shown in 5 layers: top10nl_weglijn_lijn, top10_wegdeel_hartlijn, top10nl_wegdeel_punt, top10nl_wegdeel_hartpunt, top10nl_wegdeel_vlak (from top10nl_Wegdeel.gpkg).
When you move the mouse, the mouse-over shows the layers under the pointer, the very geographic items (line, point, polygon) and their parameter values. A road is shown as line from the layer top10_wegdeel_hartlijn. One of the parameters is ‘typeweg’ indicating the road type. It can have values ‘autosnelweg’, ‘lokale weg’, ‘hoofdweg’, ‘straat’, etc. The parameter ‘naam’ indicates the name of the reoad
Now we have vector tiles, we can go on styling the map.
One issue I found was that tiles at lower zoom levels are extremely large and take time to render (sometimes even the browser gives an out-of-memory error). Setting the ogr2ogr parameter -dsco MAX_SIZE=50000000 to lower values decrease the tile size, but then features are omitted. This is clearly visible for example by holes in the sea at certain zoom levels, resulting in a poor experience. I did not find a solution for this other than omitting the lower zoom levels entirely.
Getting info
In order to get info what is inside a geopackage (info we can use during styling), we can use ogrinfo. You’d better redirect the output to a file, since it can be huge.
Layer inside a file
ogrinfo top10nl_Wegdeel.gpkg > output.txt
This results in an overview of the layers.
INFO: Open of `/home/gpkg_top10nl/top10nl_Wegdeel.gpkg'
using driver `GPKG' successful.
1: top10nl_wegdeel_lijn (Line String)
2: top10nl_wegdeel_hartlijn (Line String)
3: top10nl_wegdeel_punt (Point)
4: top10nl_wegdeel_hartpunt (Point)
5: top10nl_wegdeel_vlak (Polygon)
Used parameters
Say you are interested in the the layer top10nl_wegdeel_hartlijn and you want to know what is inside. We use the -so parameter (summary only):
ogrinfo -so top10nl_Wegdeel.gpkg top10nl_wegdeel_hartlijn > output.txtThis shows an overview what is inside the layer, amongst others the parameters:
INFO: Open of `/home/gpkg_top10nl/top10nl_Wegdeel.gpkg'
      using driver `GPKG' successful.

Layer name: top10nl_wegdeel_hartlijn
Geometry: Line String
Feature Count: 2217981
Extent: (13249.667000, 306646.275000) - (278250.000000, 618190.118000)
Layer SRS WKT:
PROJCRS["Amersfoort / RD New",
...
namespace: String (200.0)
lokaalid: String (40.0)
brontype: String (60.0)
bronactualiteit: Date (0.0)
bronbeschrijving: String (240.0)
bronnauwkeurigheid: Real (0.0)
mutatietype: String (64.0)
typeweg: String (254.0)
hoogteniveau: Integer64 (0.0)
typeinfrastructuur: String (60.0)
...
All info
If you want to have it all:
ogrinfo -al top10nl_Wegdeel.gpkg top10nl_wegdeel_hartlijn > output.txtThis can take a few minutes. Basically the geopackage is dumped in text file. In this case: it dumps all roads of the Netherlands, which are a couple of millions. The file will be huge, around 3 GByte in this case. This file may come in handy if we want to know what parameter values are used in the layer.
Used parameter values
Using Linux we can get a list of all used parameter values of for instance typeweg by using following:
cat output.txt | grep typeweg | sort | uniqIn fact it filters all lines in the file that contain ‘typeweg’ and prints the unique values. This results in:
typeweg: String (254.0)
  typeweg (String) = autosnelweg
  typeweg (String) = hoofdweg
  typeweg (String) = lokale weg
  typeweg (String) = overig
  typeweg (String) = regionale weg
  typeweg (String) = rolbaan, platform
  typeweg (String) = startbaan, landingsbaan
  typeweg (String) = straat
  typeweg (String) = veerverbinding
Improving performance
As you can see in the map info and inspection image above, each layer item contains a lot of information (fields) that we will never use. For example, each layer contians ‘brontype’, ‘bronactualiteit’, ‘bronbeschrijving’. We can use the select option of ogr2ogr to select just what we want. Instead of adding all source layers from a geopackage:
ogr2ogr -f GPKG nederland2020-10nl.gpkg top10nl_top10nl_FunctioneelGebied.gpkgwe select on a layer by layer basis the fields that we want in our map:
ogr2ogr         -f GPKG -select typefunctioneelgebied,soortnaam,naamnl nederland2020-10nl.gpkg top10nl_FunctioneelGebied.gpkg top10nl_functioneel_gebied_vlak
ogr2ogr -update -f GPKG -select typefunctioneelgebied,soortnaam,naamnl nederland2020-10nl.gpkg op10nl_FunctioneelGebied.gpkg top10nl_functioneel_gebied_multivlak
ogr2ogr -update -f GPKG -select typefunctioneelgebied,soortnaam,naamnl nederland2020-10nl.gpkg top10nl_FunctioneelGebied.gpkg top10nl_functioneel_gebied_punt
In the final mbtiles file this results in a size reduction of 35%. Data that does not need to be downloaded and does not need to be parsed. It also results in a conversion improvement (to mbtiles file) of about the same amount. If we now inspect the result we see a neat list of layers, features and field lists that fits the window:
In the download section at the end of this post you will find in the zip
- An Excel file containing all layers and fields of each geopackage
- A file containing the
ogr2ogrinstructions for removing all unnecessary fields from each layer
Styling the vector based map
TileServer GL uses MapBox style files to define the looks of the map. The style file is a JSON file that describes which map elements are shown and how they are shown. We are not going to fully explain the style format, just a few basic ideas.
We start by adding a style to our config file:
  "styles":
  {
    "PDOK BRT Top10NL":
    {
      "style": "pdok/style_top10nl.json",
      "tilejson": {
        "bounds": [
          1.9666667,
          50.7480541,
          8.5709549,
          54.4229599
        ]
      }
    }
  }
As such, we define a style called ‘PDOK BRT Top10NL’ which uses pdok/style_top10nl.json as style file. We now need to create this style file. As example, next snippet describes to draw a background and show farmland.
{
	"version": 8,
	"name": "PDOK BRT Top10NL",
	"glyphs": "{fontstack}/{range}.pbf",
	"sources": {
		"brt_top10nl": {
			"type": "vector",
			"url": "mbtiles://{PDOK Top10nl}"
		}
	},
	"sprite": "{styleJsonFolder}/sprites/sprites",
	"layers":[
		{
			"id":  "background",
			"type": "background",
			"paint":
			{
				"background-color":"#EFEFEF"
			}
		},
		{
			"id": "top10nl_terrein_vlak_akkerland",
			"type": "fill",
			"source": "brt_top10nl",
			"source-layer" : "top10nl_terrein_vlak",
			"maxzoom": 20,
			"minzoom": 12,
			"filter": ["==", "typelandgebruik", "akkerland"],
			"paint": {
				"fill-opacity": 1,
				"fill-color": "#FFFDED",
				"fill-outline-color": "#CCCCAA"
			}
		},
		...
	]
}
Note: the first lines define the source data and where to find things. The line "url": "mbtiles://{PDOK Top10nl}" indicates to use the source PDOK Top10nl from our config file, defined in the data section.
The layers section contain the items that will be displayed. Each section with an id describes one or more items to display. They are rendered in the order in which they are presented (z-order). The parameter source defines the map source, source-layer the layer and filter allows for filtering items from that layer. The layout and paint section define how the items are displayed.
It is possible to use sprites to generate texture, for example for indicating the type of forrest. We need two image files spites.png and sprites@2x.png, containing all the sprites in normal and 2x enlarged format.
And we need two accompanying JSON files, sprites.json and sprites@2x.json, defining the sprites and their location in the image file.
{
  "loofbos":
  {
    "height": 16,
    "width": 16,
    "pixelRatio": 1,
    "x": 0,
    "y": 0
  },
  "naaldbos":
  {
    "height": 16,
    "width": 16,
    "pixelRatio": 1,
    "x": 16,
    "y": 0
  },
  ...
}
In our style JSON file we. define the sprites with "sprite": "{styleJsonFolder}/sprites/sprites". We now can use the sprites in our layer definitions in the style JSON using fill-pattern, for example:
		{
			"id": "top10nl_terrein_vlak_loofbos",
			"type": "fill",
			"source": "brt_top10nl",
			"source-layer" : "top10nl_terrein_vlak",
			"maxzoom": 20,
			"minzoom": 6,
			"filter": ["in", "typelandgebruik", "bos: loofbos"],
			"paint": {
				"fill-pattern": "loofbos",
				"fill-opacity": 1,
				"fill-outline-color": "#C3DBB5"
			}
		},
Though tools like the on-line Maputnik tool can be used, I just edited the JSON file. Finally we end up with a nicely styled map:
Download
My TileServer GL configuration including the style files for the PDOK Top10NL map can be downloaded as zip file using the button below. The zip contains also information on the PDOK geopackages (excel) and conversion examples. The styling is still under construction. I will update the version when finished.