Introduction
I still find Oziexplorer an excellent and versatile program for navigation, despite of the many, many apps relying on on-line maps.
This page describes how to create Oziexplorer maps from GeoTIFF, including map merge. As an example we take the Basis Registratie Topografie (BRT) Top25raster 1:25.000 maps of the Netherlands that can be downloaded from PDOK and we will create an ozfx4 map covering the entire Netherlands.
The GeoTIFF format is an image tif format that contains geo information.
Processing
Creating .map files
After downloading the raster files from PDOK and extracting the tif files we end up with 490 GeoTIFF (.tif) files.
First step is to create the .map files required for OziExplorer.
Attempt 1: fail
OziExplorer seems to be able to do the job for us. Select ‘Import map‘ -> ‘All DRG Maps on a CD or in a Folder‘. Select ‘Image File Path‘ and ‘Map File Path‘ to be the folder where the tif files are. Press ‘Import‘.
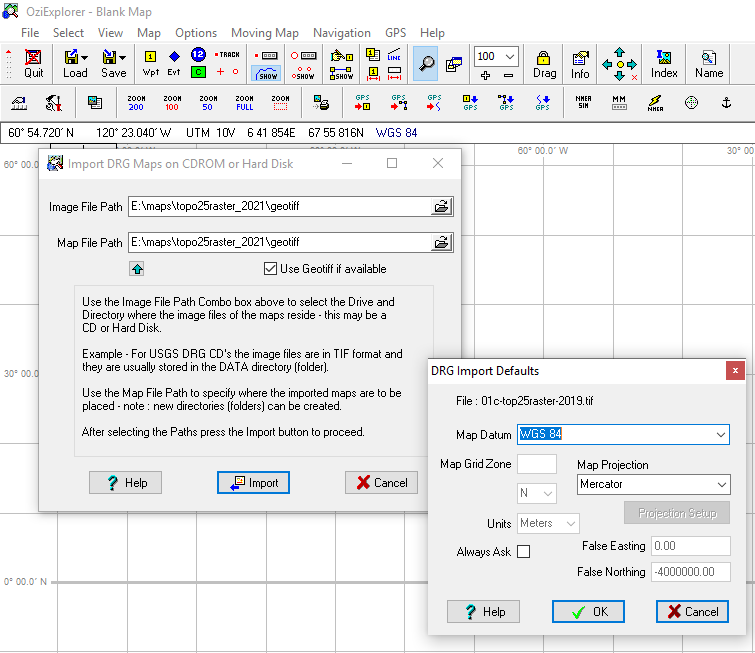
Select ‘Map Datum‘ to be ‘WGS 84’. For ‘Map Projection‘ we need ‘Transverse Mercator’. However, this is not supported, so we choose ‘Map Projection‘ to be ‘Mercator’ and press ‘Ok‘. Within a blink of an eye the map files are generated and placed in the Map File Path.
However I found this method to present maps with incorrect calibration data. Here it ends…
Atempt 2: almost there
A method that works is conversion using the tool MAPC2MAPC. The tool must be bought.
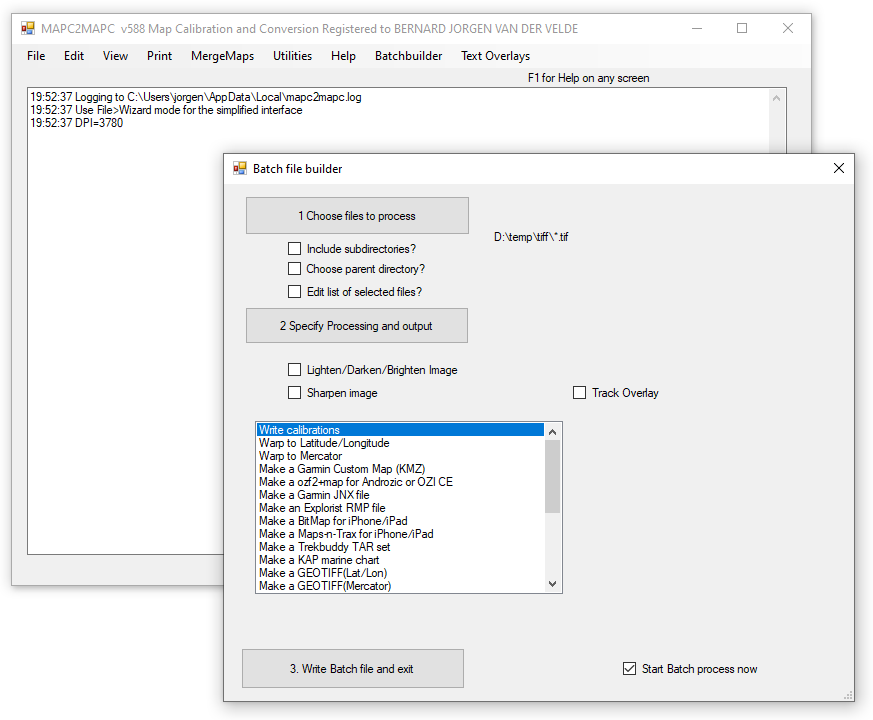
Choose ‘Batchbuilder‘. Select at 1. the directory/files you want to convert. Select at 2. the option ‘Write calibration‘. Then press 3. MAPC2MAPC creates a batch file MAPC2MAPC.bat and executes it. A directory /output is created in the source directory in which the map files are converted to .png file together with all kind of calibration files. Amongst the latter are .map files for Oziexplorer.
The TOP25raster maps use EPSG:28992 coordinate system (Amersfoort/RD new). It uses a stereographic projection. We find this in the generated .map files as datum setting ‘AMERSFOORT‘, projection ‘Stereographic‘ and the correct projection setup.
However, we need to change ‘AMERSFOORT‘ to ‘Rijksdriehoeksmeting‘ and ‘Stereographic‘ to ‘(PST) Polar Stereographic‘ in order for Ozi explorer to understand it. After this the result looks fairly nice in OziExplorer. However on closer look we find slight deviations of about 10 m. Also the result after merging multiple maps shows white spaces between the mpas.
Attempt 3: doing it right
To get things the way I want I wrote a small Java program, available on Github. The software takes the excel sheet delivered by PDOK describing the maps, including the calibration, and generates the .map files based on this. Refer to the read-me on Github describing how to proceed.
The OziExporer map files contains calibration data in two places:
- The reference points
These points are used by OziExporer for getting the projection right. In the excerpt below it is printed in red. The coordinates are Rijksdriehoeksmeting (RD) coordinates (easting, northing) - The moving map section
These settings are used for detecting adjacent maps in OziExporer and by Ozi Map Merge for the map outline! The coordinates are latitude/longitude coordinates according to the Bessel 1841 map datum (and not WGS84) for Rijksdriehoeksmeting! Gee… it took me a hell of a time to find this out!
...
Rijksdriehoeksmeting,WGS 84,   0.0000,   0.0000,WGS 84
...
Map Projection,Transverse Mercator,PolyCal,No,AutoCalOnly,No,BSBUseWPX,No
Point01,xy,    0,    0,in, deg,    ,    ,,  ,  ,, grid,   , 230000, 587500,N
Point02,xy, 8000,10000,in, deg,    ,    ,,  ,  ,, grid,   , 240000, 575000,N
Point03,xy,     ,     ,in, deg,    ,    ,,  ,  ,, grid,   ,       ,       ,
...
Projection Setup,     0.000000000,     5.387633333,     0.999907900,       155000.00,-5316592.00,    ,    ,,,
...
MM0,Yes
MMPNUM,4
MMPXY,1,0,0
MMPXY,2,8000,0
MMPXY,3,8000,10000
MMPXY,4,0,10000
MMPLL,1,   6.511943870180266,  53.26988554676676
MMPLL,2,   6.661817475798454,  53.26838910448032
MMPLL,3,   6.658512240114187,  53.156079070672504
MMPLL,4,   6.509027225559721,  53.157570558404394
MM1B,2.496705
Hence the software generates the map files: based on the RD coordinates provided in the PDOK Excel file and a template .map file it calculates and fills in the RD and Bessel 1841 coordinates. Fortunatelly I found an article of an anonymous author describing an how to calculate Bessel 1841 coordinates out of RD coordinates. Thank you anonymous author!
In the template we use the transverse mercator projection, with central meridian at 5.387633333 degrees, a scale factor of 0.999907900 and false easting and northing of 155000 resp -5316592 meter. To be honest, I don’t understand where the negative false northing comes from (it should be +463000 meter). In the same way I don’t understand the transverse mercator projection, since I read that Rijksdriehoeksmeting uses a stereographic projection. I guess both weirdnesses are related… Anyway, with these settings we get excellent results.
Voilà! We have excellent, correct OziExporer .map files. After map merge we end up with a nice result in which the maps lying exactly adjacent to each other.
Merging maps
In the way described above we end up with 390 Oziexplorer maps and the original GeoTiff files. This is not handy in practical use, though we can use the OziExplorer moving maps feature. Therefore we use Ozi Map Merge to merge the maps together into one map file covering the entire Netherlands. Map Merge is a tool that can be bought and is dedicated to one machine. However, the free version is limited to the ozf4 output format and this is exactly what we want.
Import the maps by adding the directory using the ‘Add’ button. It takes a while when Map Merge scans the tif/map files.
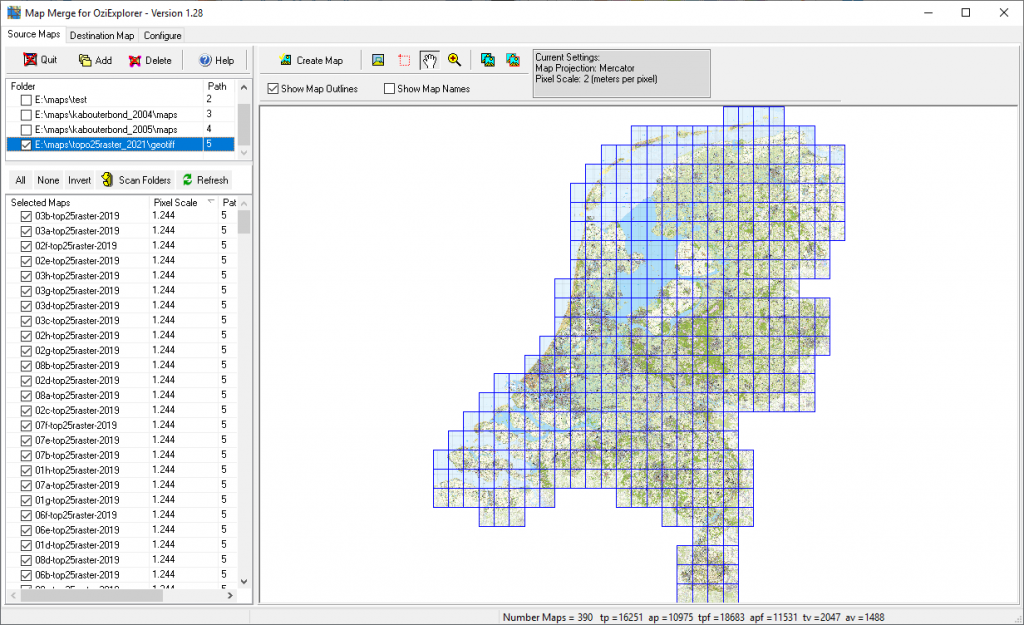
Select under the ‘Destination map‘ tab the WGS 84 map datum and Transverse Mercator projection. Together with this, we use the same projection settings as above. This gives us the nicely horizontally/vertically aligned maps as shown above.
You can also set the pixel scale: the number of meters per pixel. Refer to the original pixel scale shown in the map table. I guess it is wise to choose a pixel scale equal or larger than the original pixel scale. A higher value means a smaller output map. In the example below we choose 2 m per pixel.
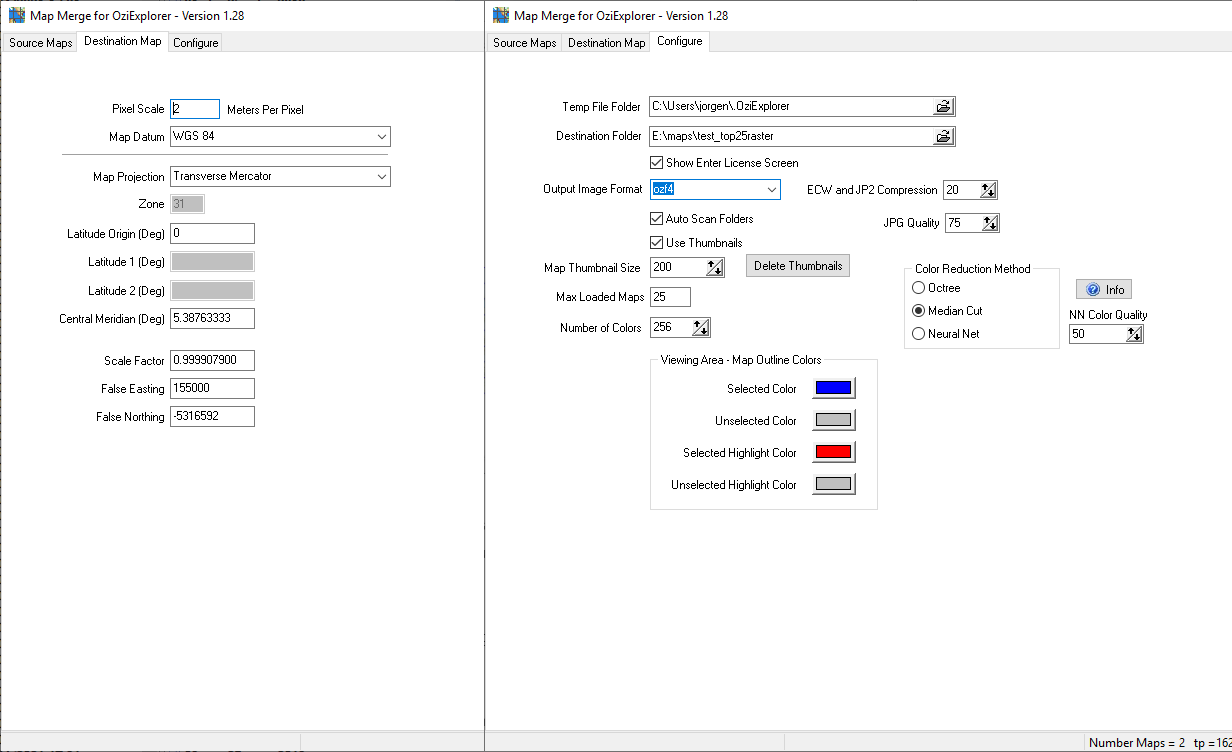
Select under ‘Configure‘ the ozfx4 output format. Leave the rest to default values.
Press the ‘Create map’ button. Now the program starts crunching. It will take a while. In the example above it took 10 hours on a Intel I7 processor.
When finished, the map can be used in Oziexplorer. I tested it on the PC as well on the mobile version on my phone.